Industrial IIoT Ecosystem

A unified ecosystem for collecting, dispatching, and analyzing telemetry data

Nine subsystems on a shared core, from polling gas, water, heat, and electricity metering devices to SCADA dispatching, operational workflows, document handling, and a fault-tolerant cluster. One data model, one access layer, one interface.

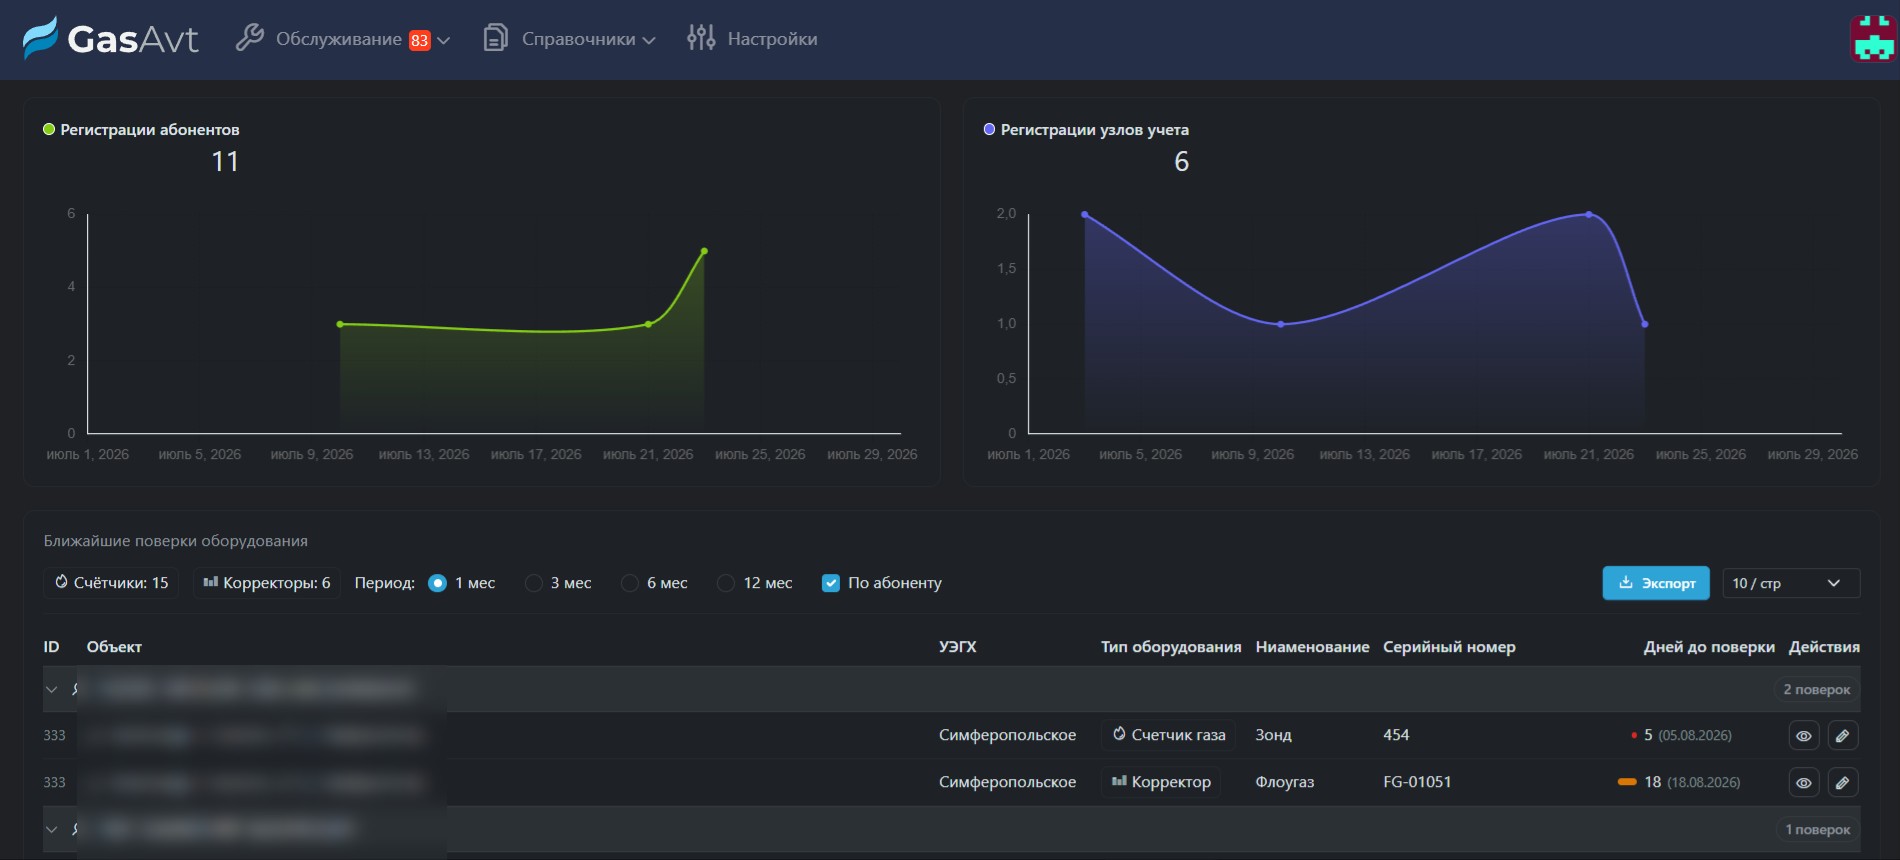
Interface: Data collection and analytics
01

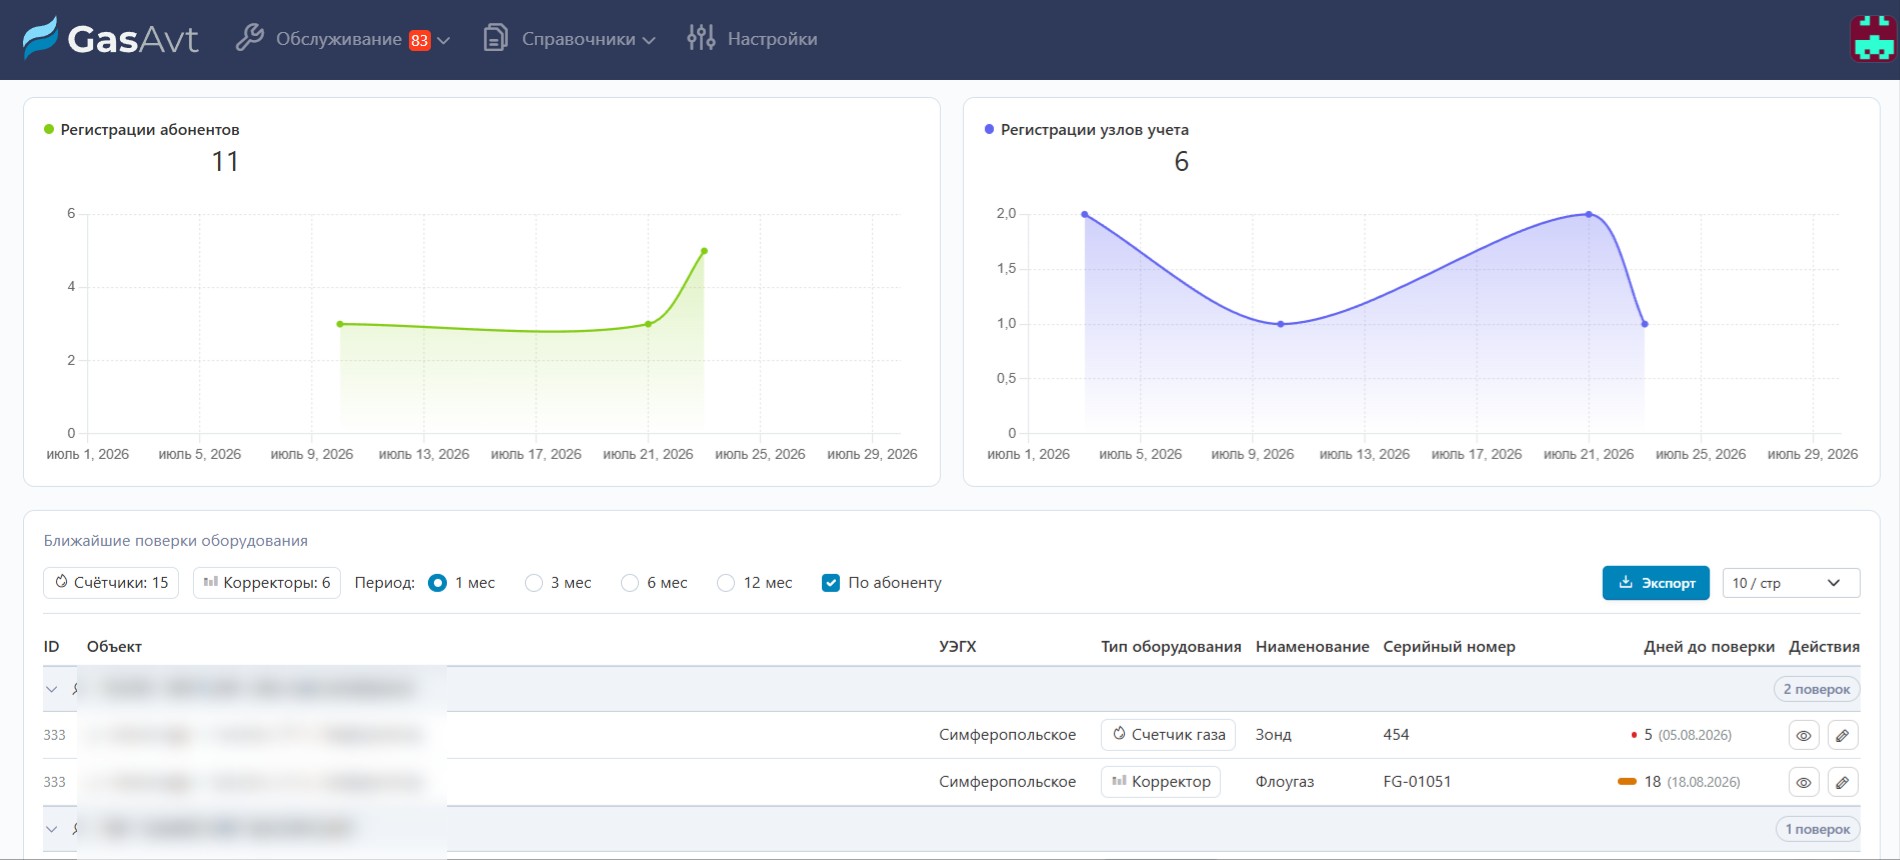
Data collection and analytics

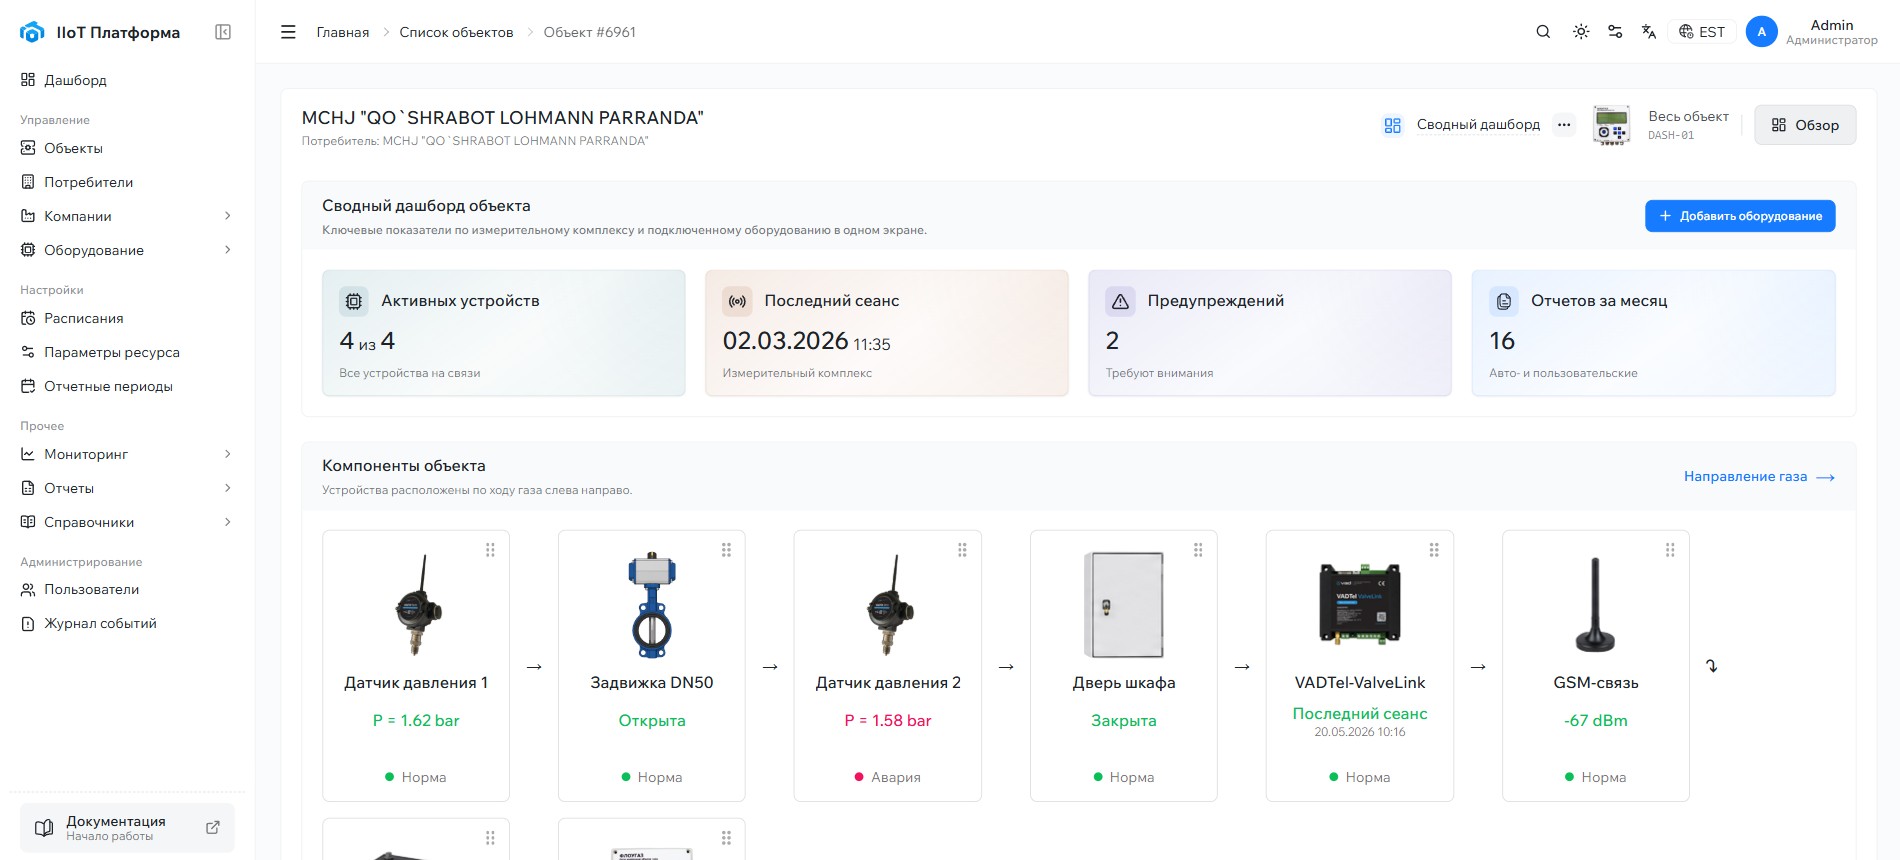
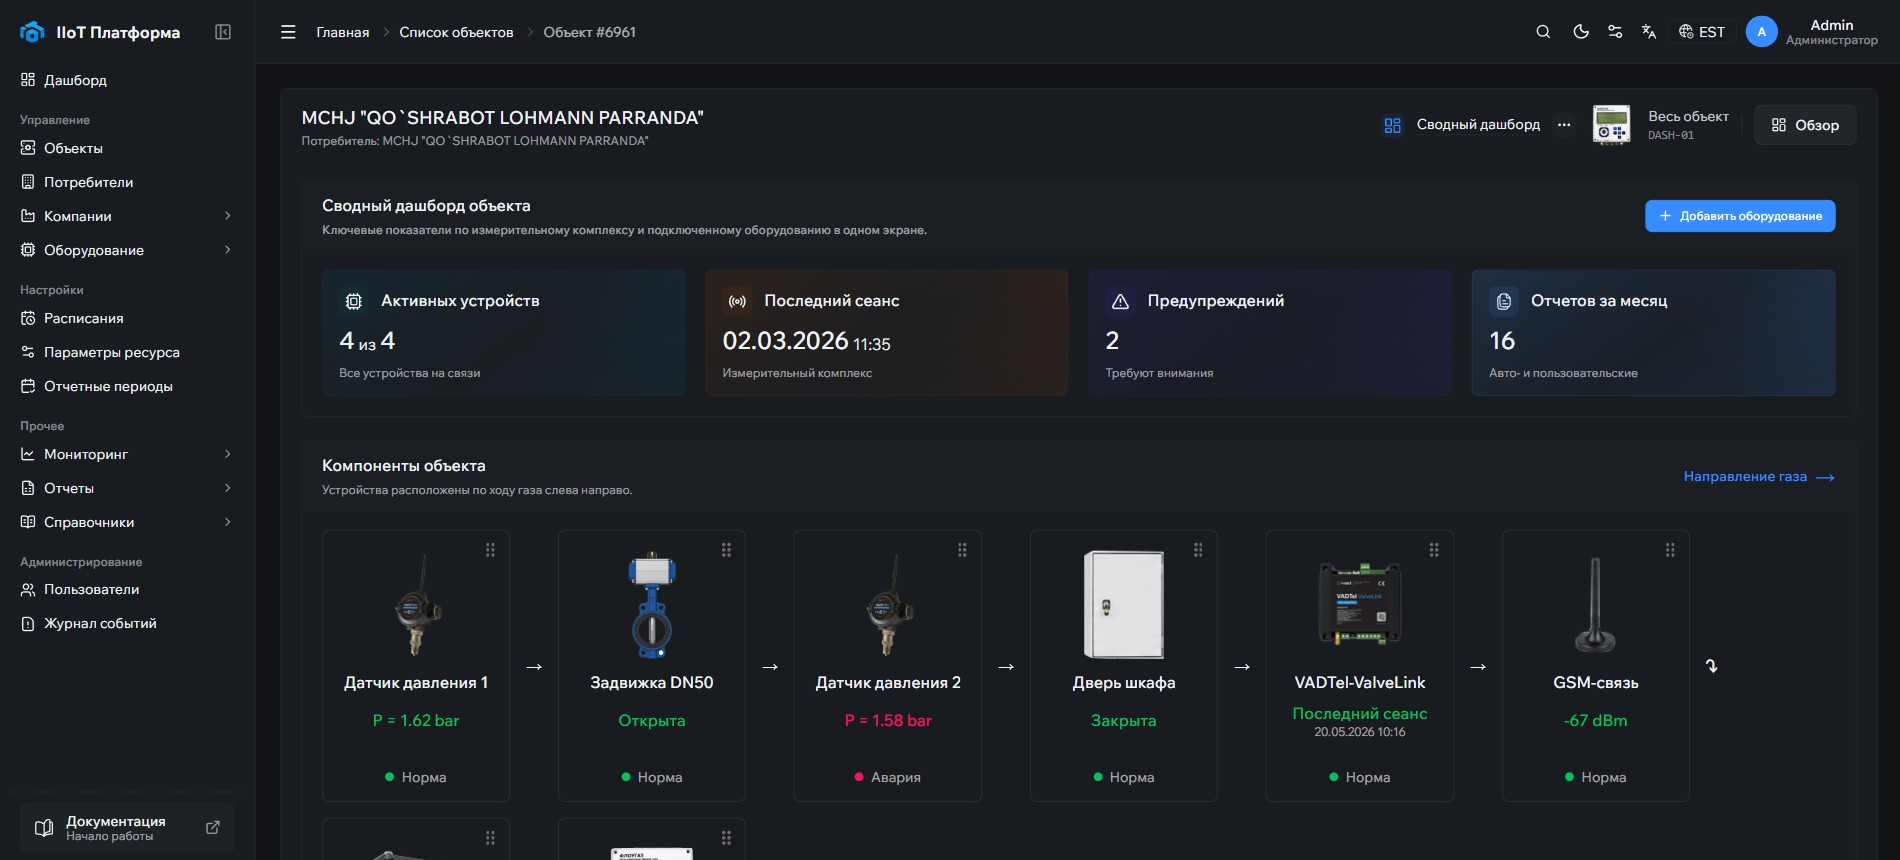
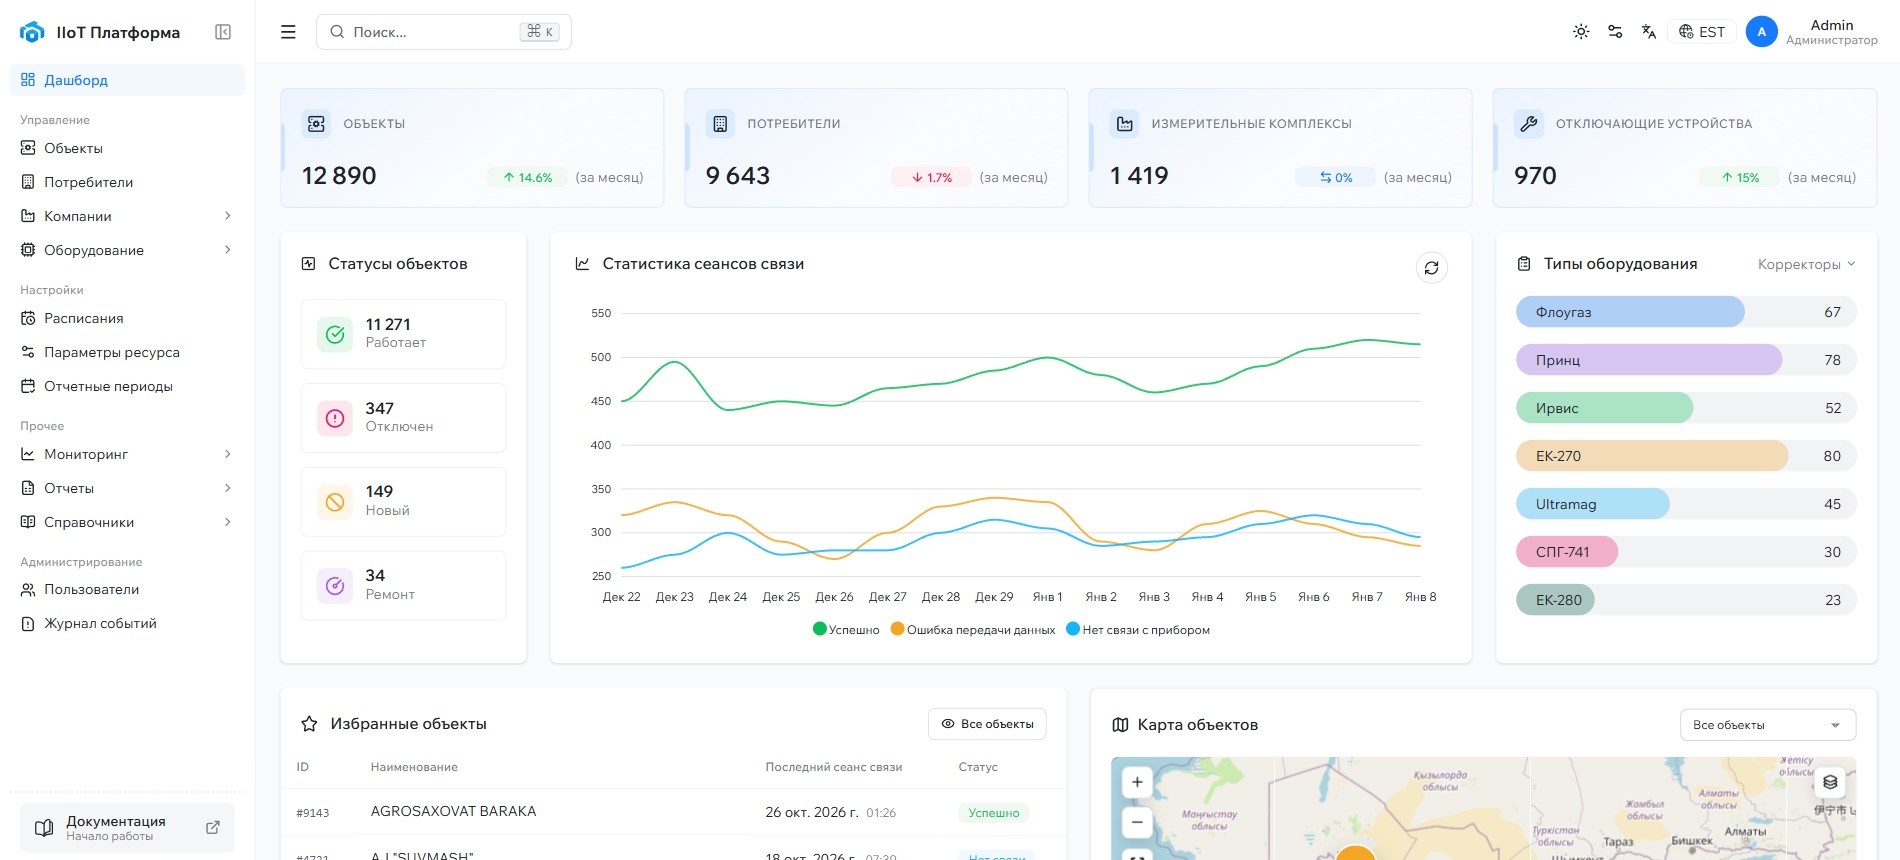
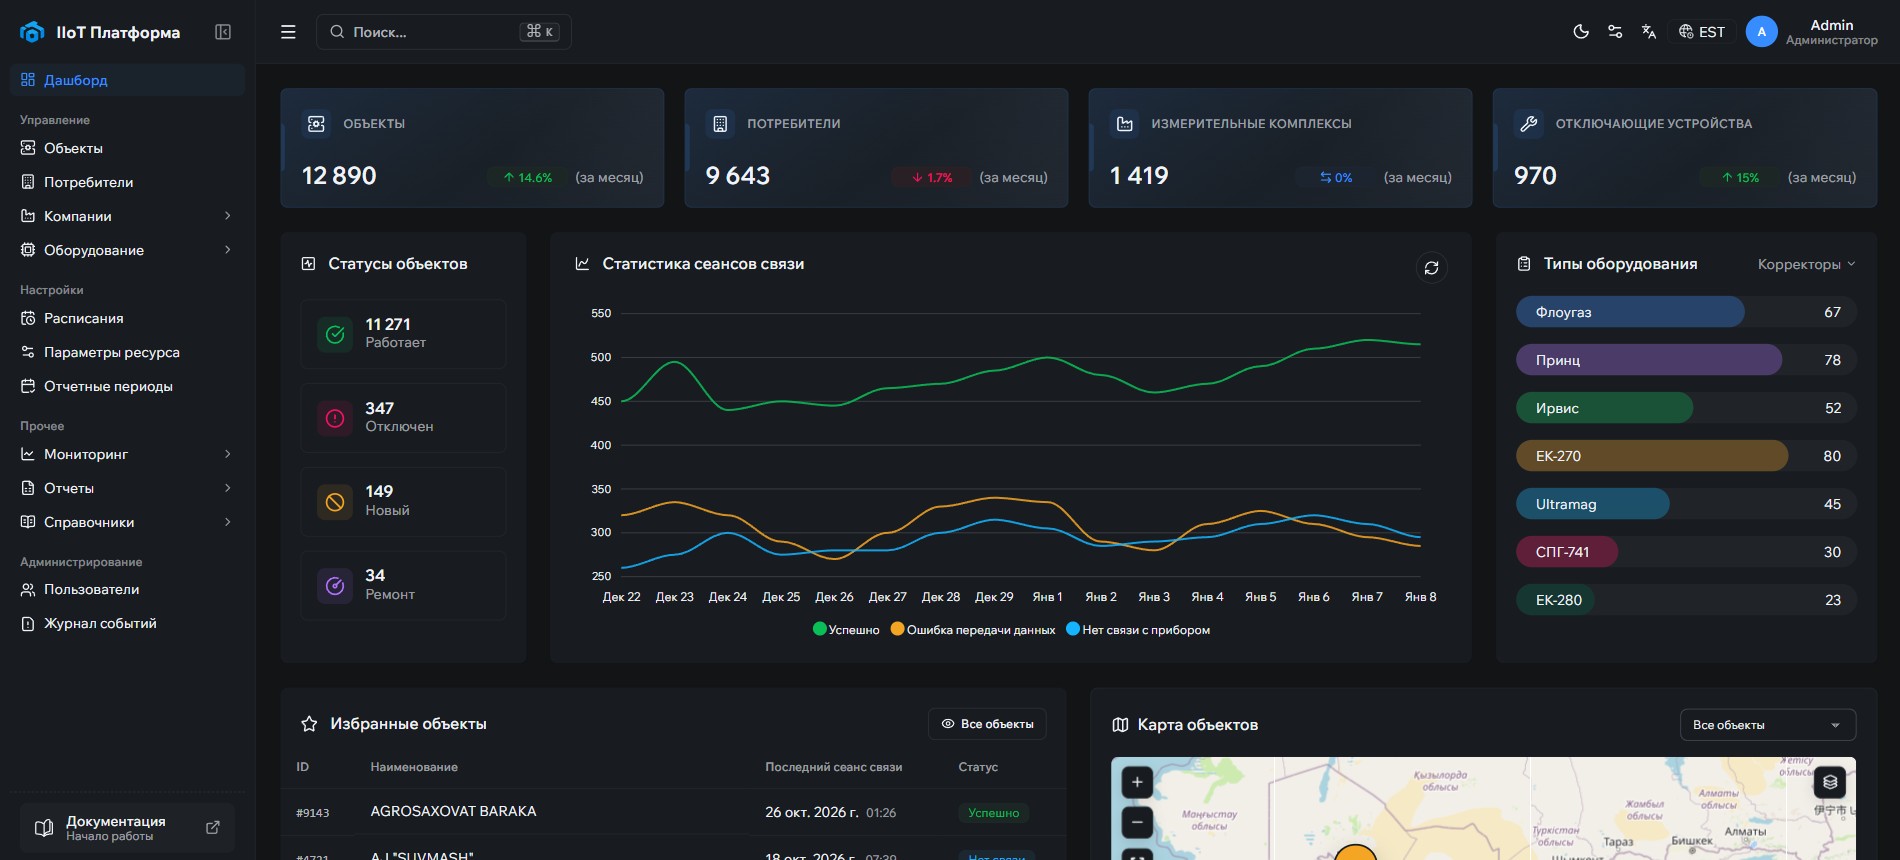
Scheduled and on-demand polling of metering devices, validation, hourly and daily archives, and predictive analytics on a shared data model.

Dashboard Sites Consumers Companies Schedules Archives
Open module /collect
Interface: SCADA dispatching
02

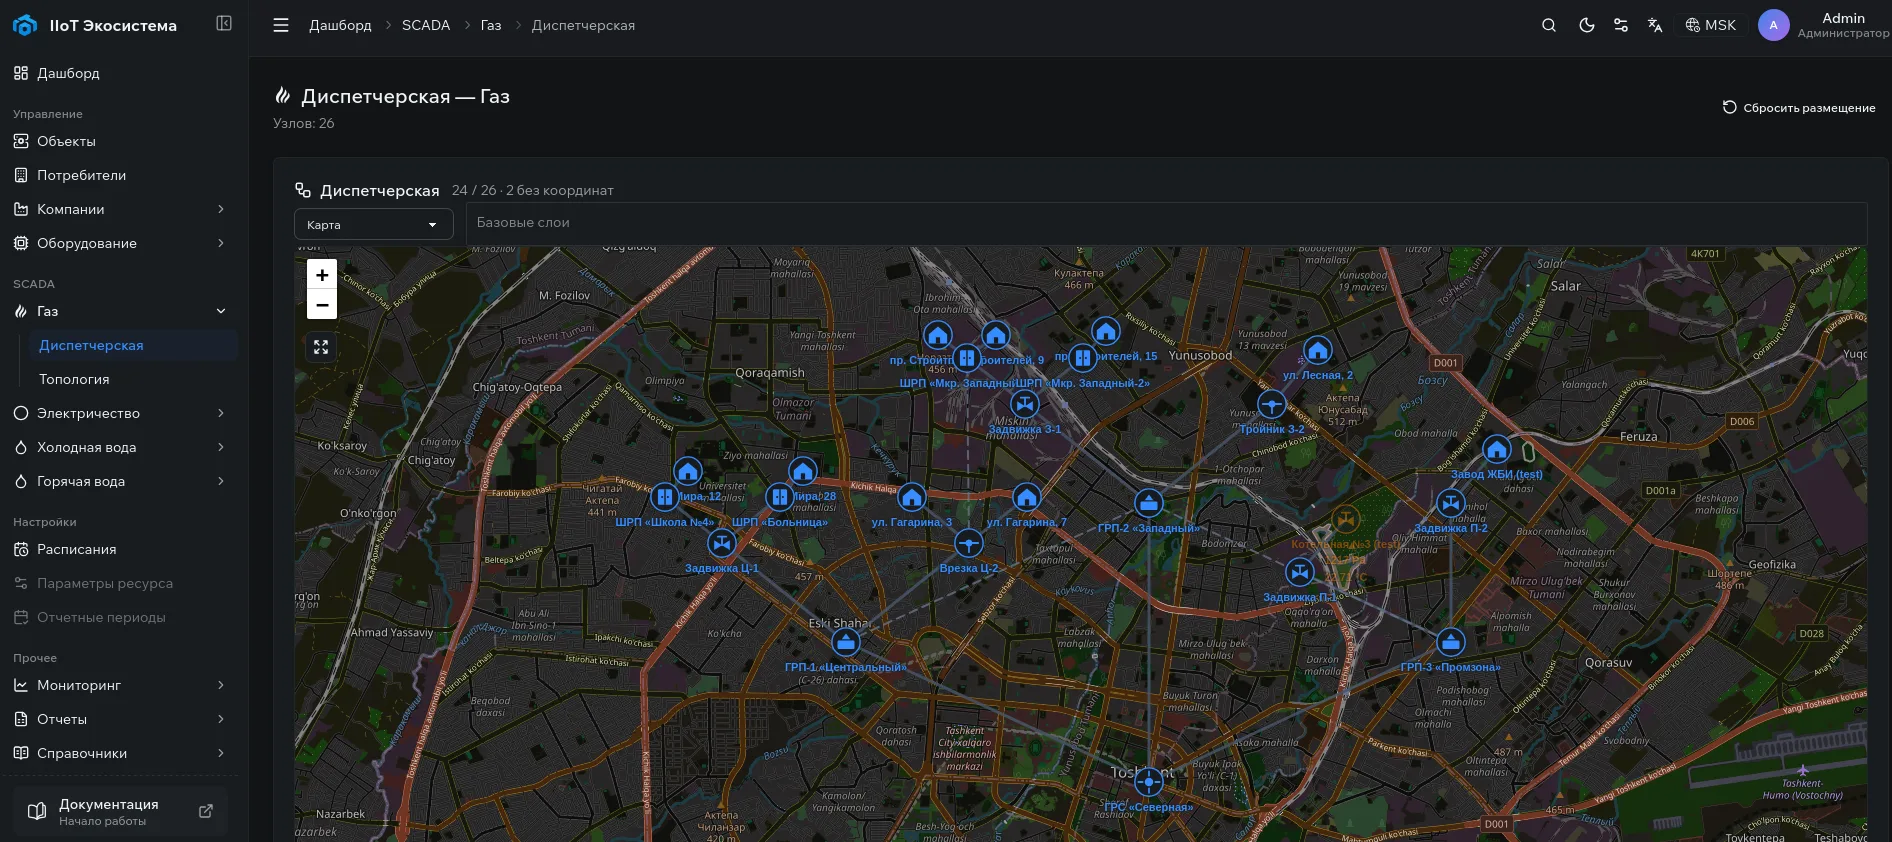
SCADA dispatching

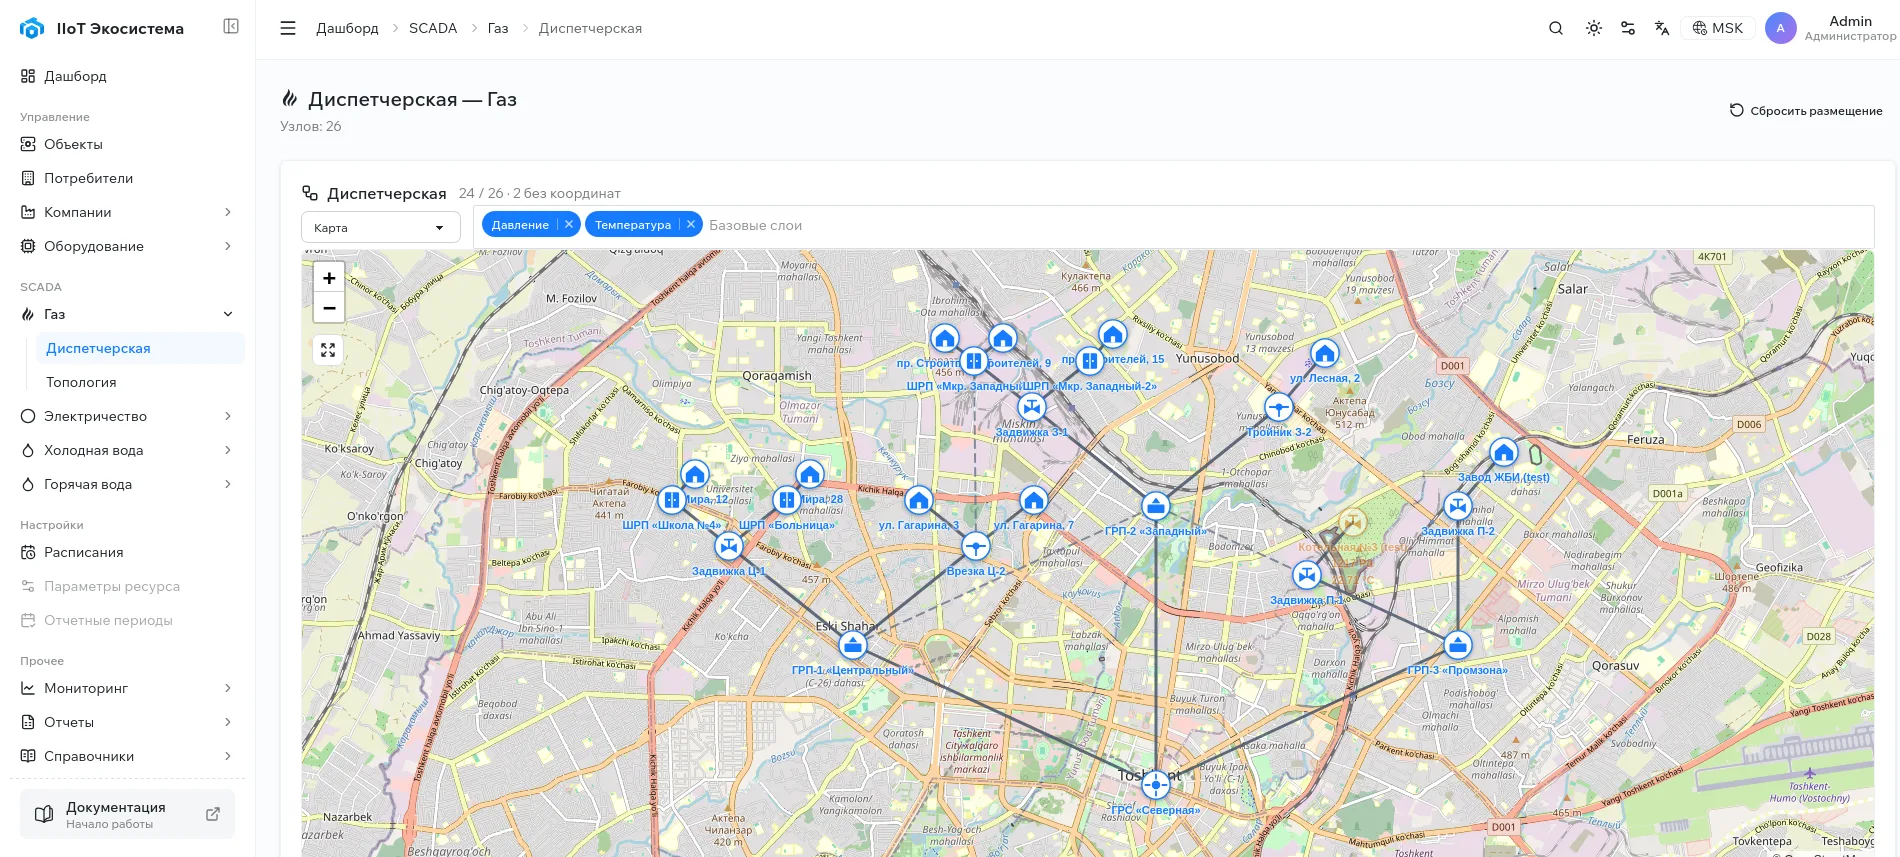
A network map with GDS, GRP, and shutoff valves, object mnemonics, and telemetry layers over the scheme for the dispatcher workspace.

Site map Mnemonics Alarms Valves Journal
Interface: Operational Health Matrix
03

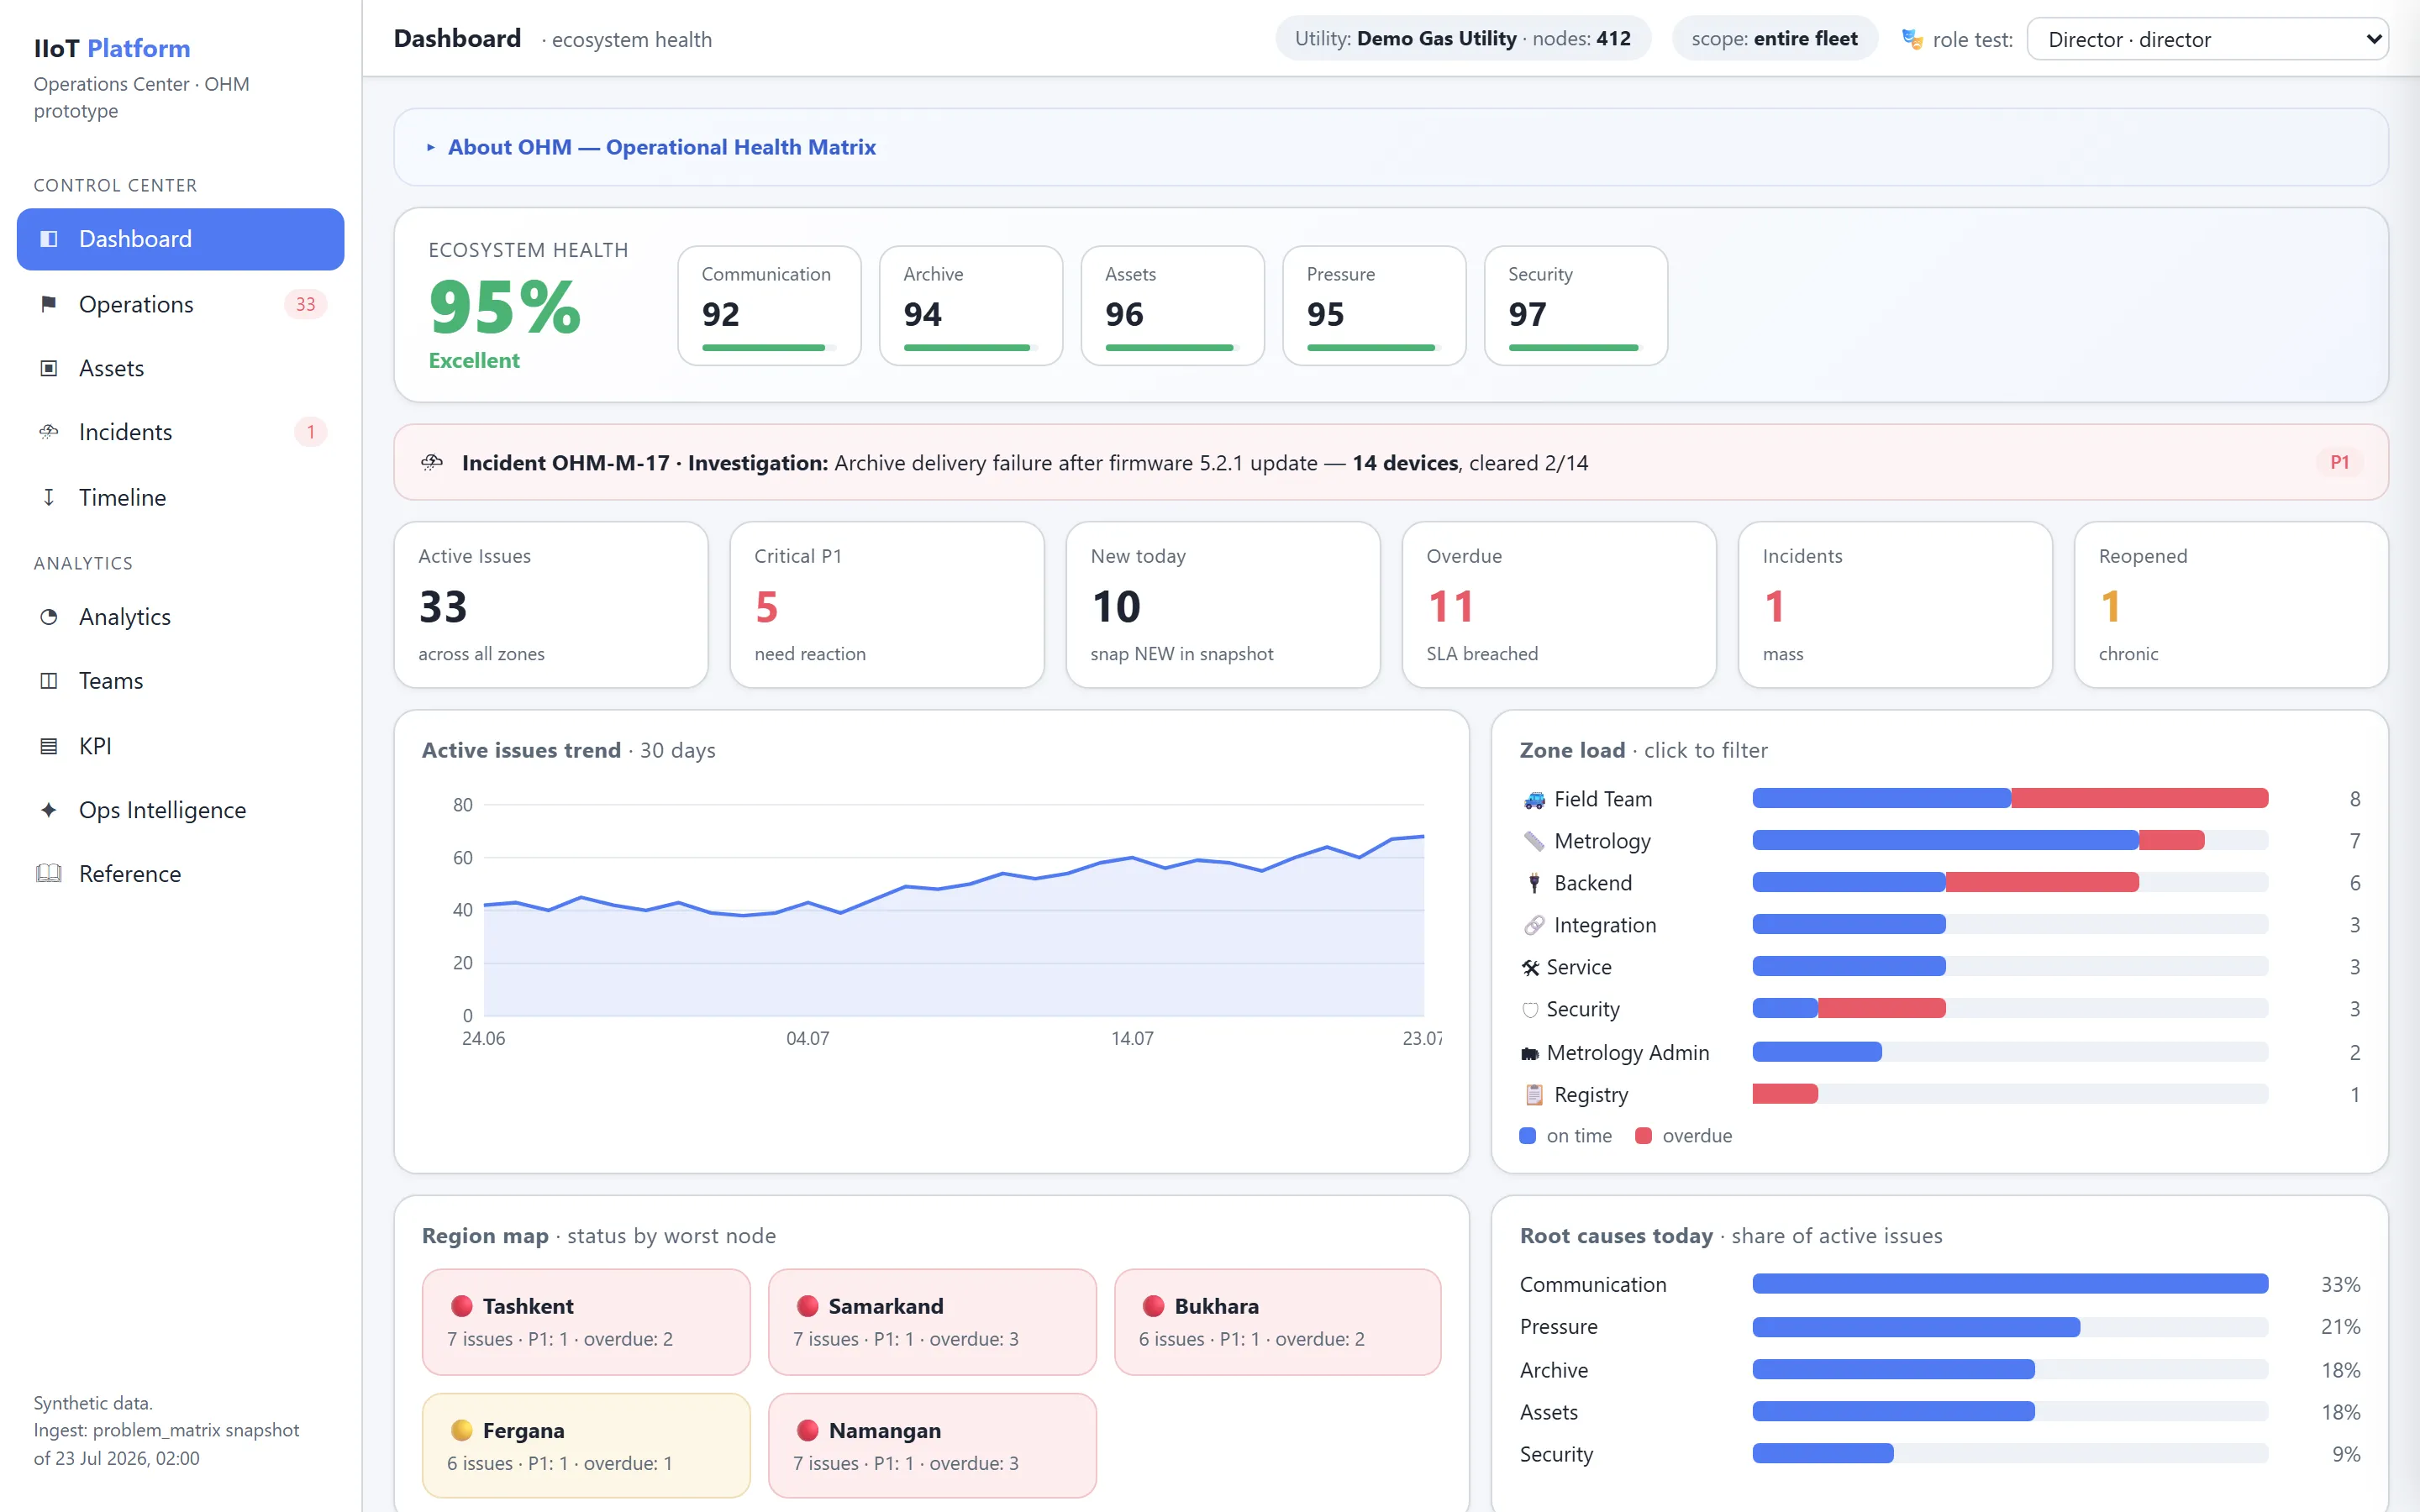
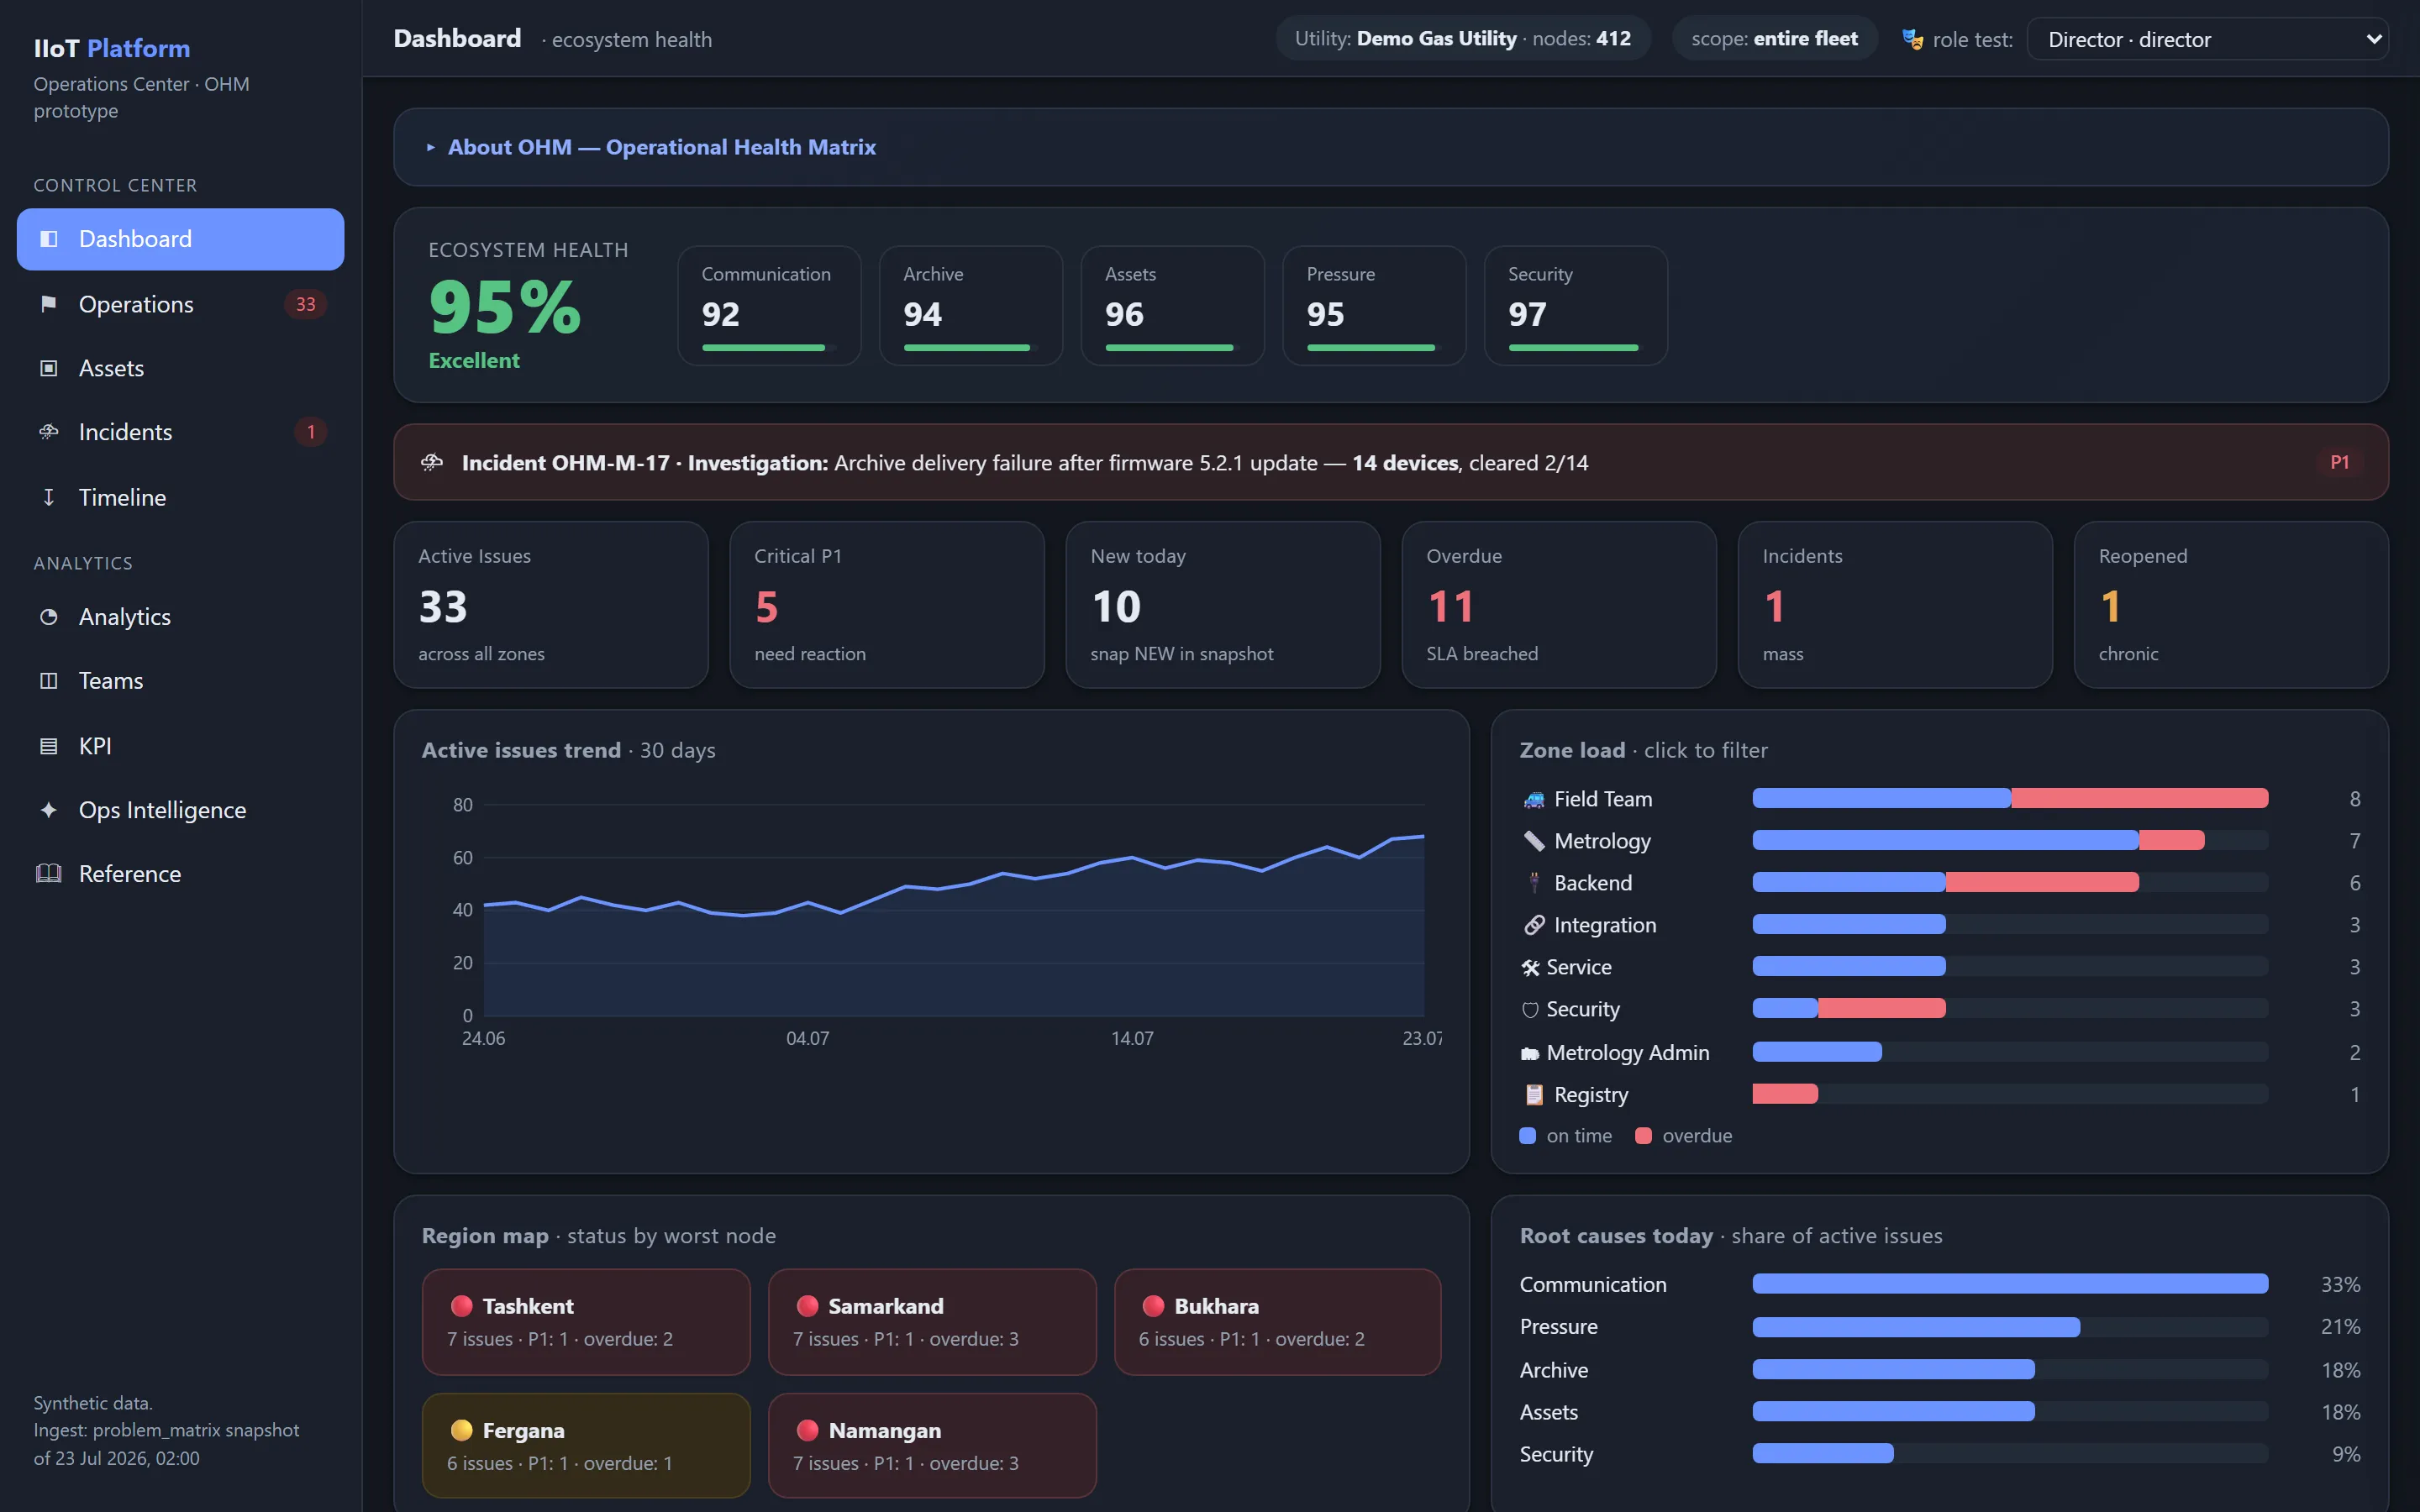
IIoT Fleet Operations Center OHM New

Detection of technical, metrological, and integration issues, owners and SLA for every task, and closure with automatic verification based on fresh data.

Asset health Issues Work queue SLA KPI
Interface: Metering unit maintenance
04

Metering unit maintenance

Scheduled maintenance, service calendars, tickets and work orders for field teams, and calibration and replacement control with full history for every unit.

Tickets Work orders Service schedule Calibrations History
Open module /service
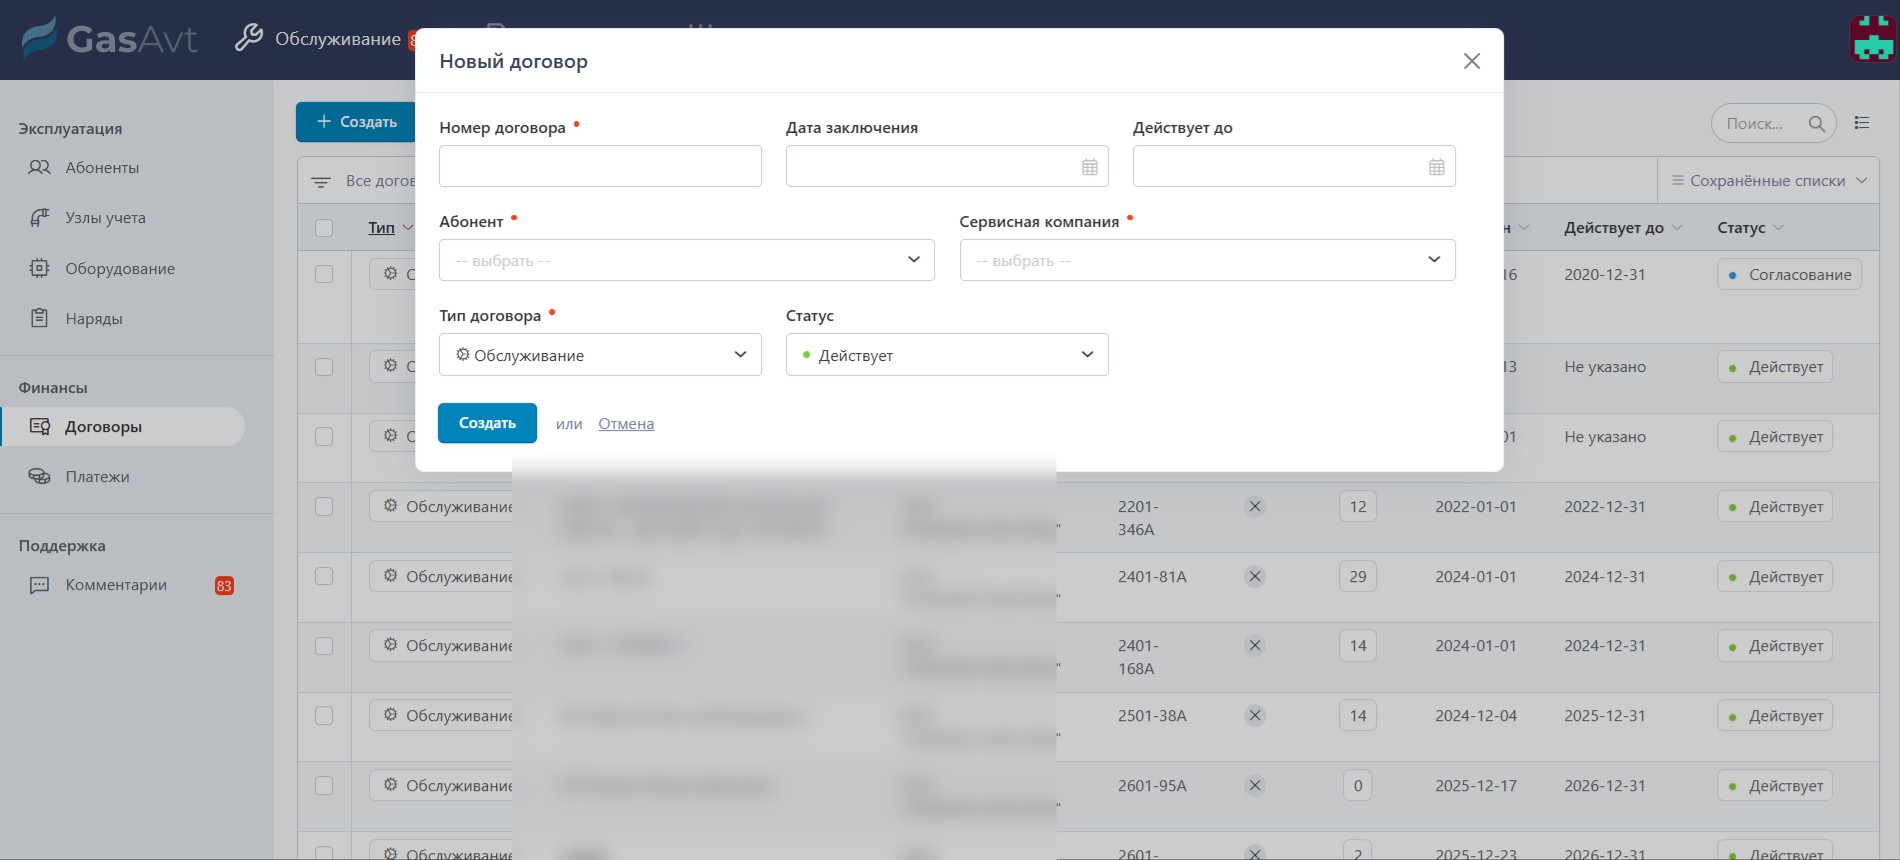
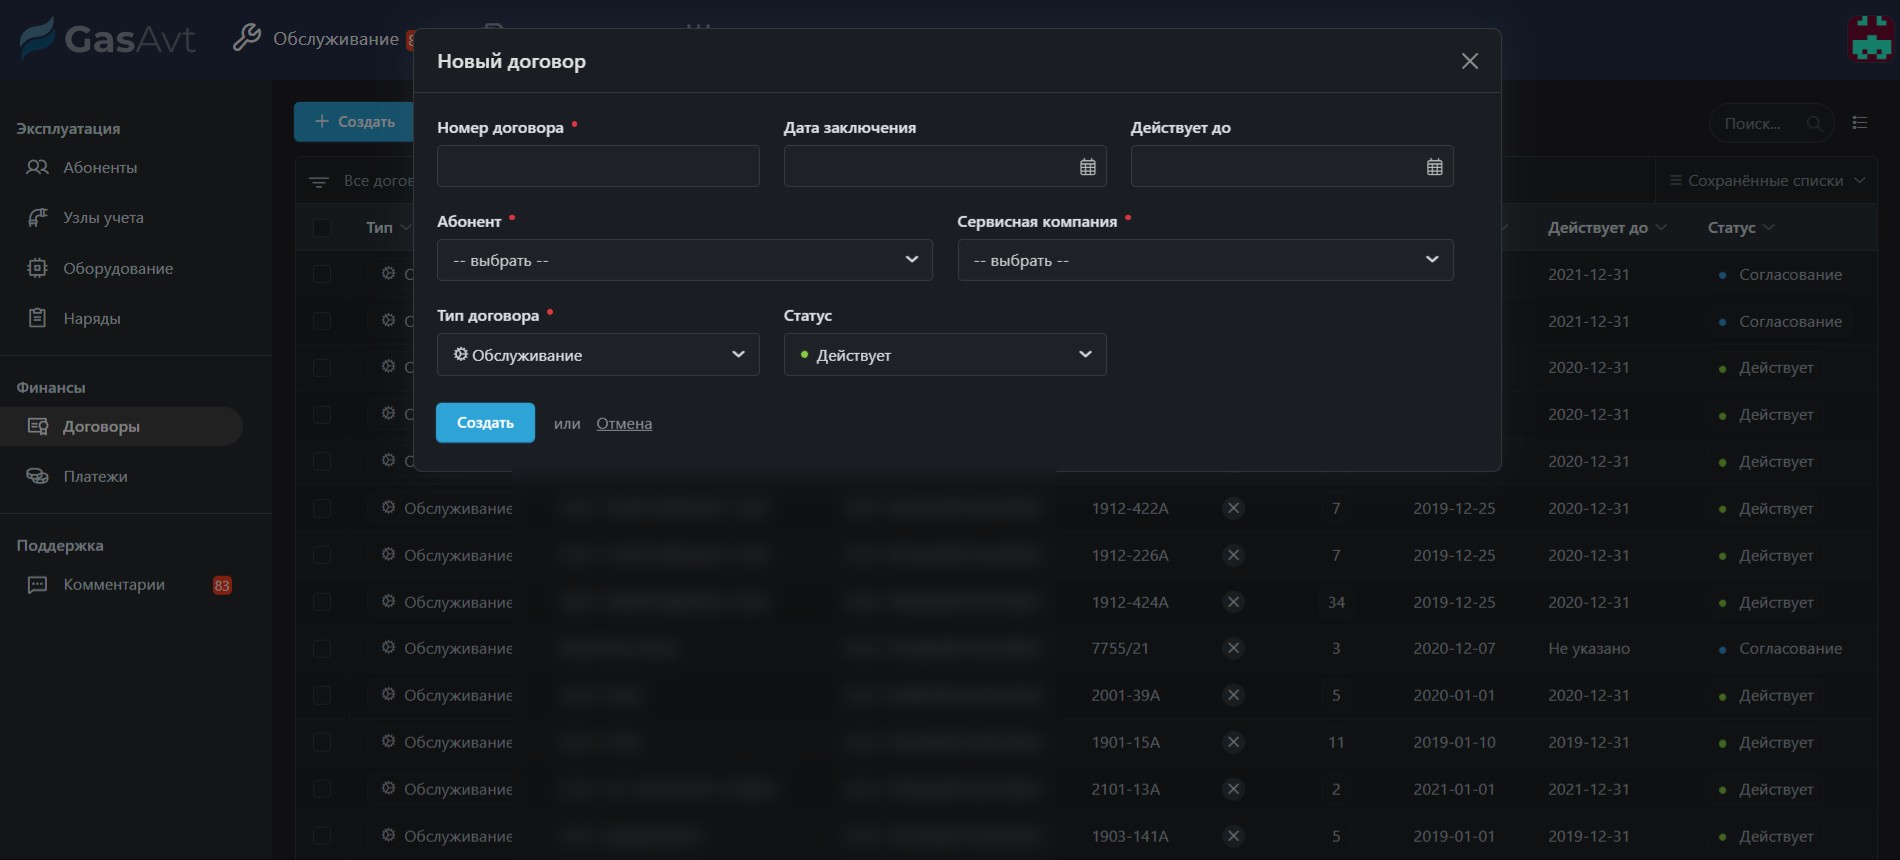
Interface: Document workflows
05

Document workflows

Relationships with counterparties: contracts, acts, and supporting documents are kept next to the metering site they belong to.

Counterparties Contracts Acts Approvals
Open module /paperwork
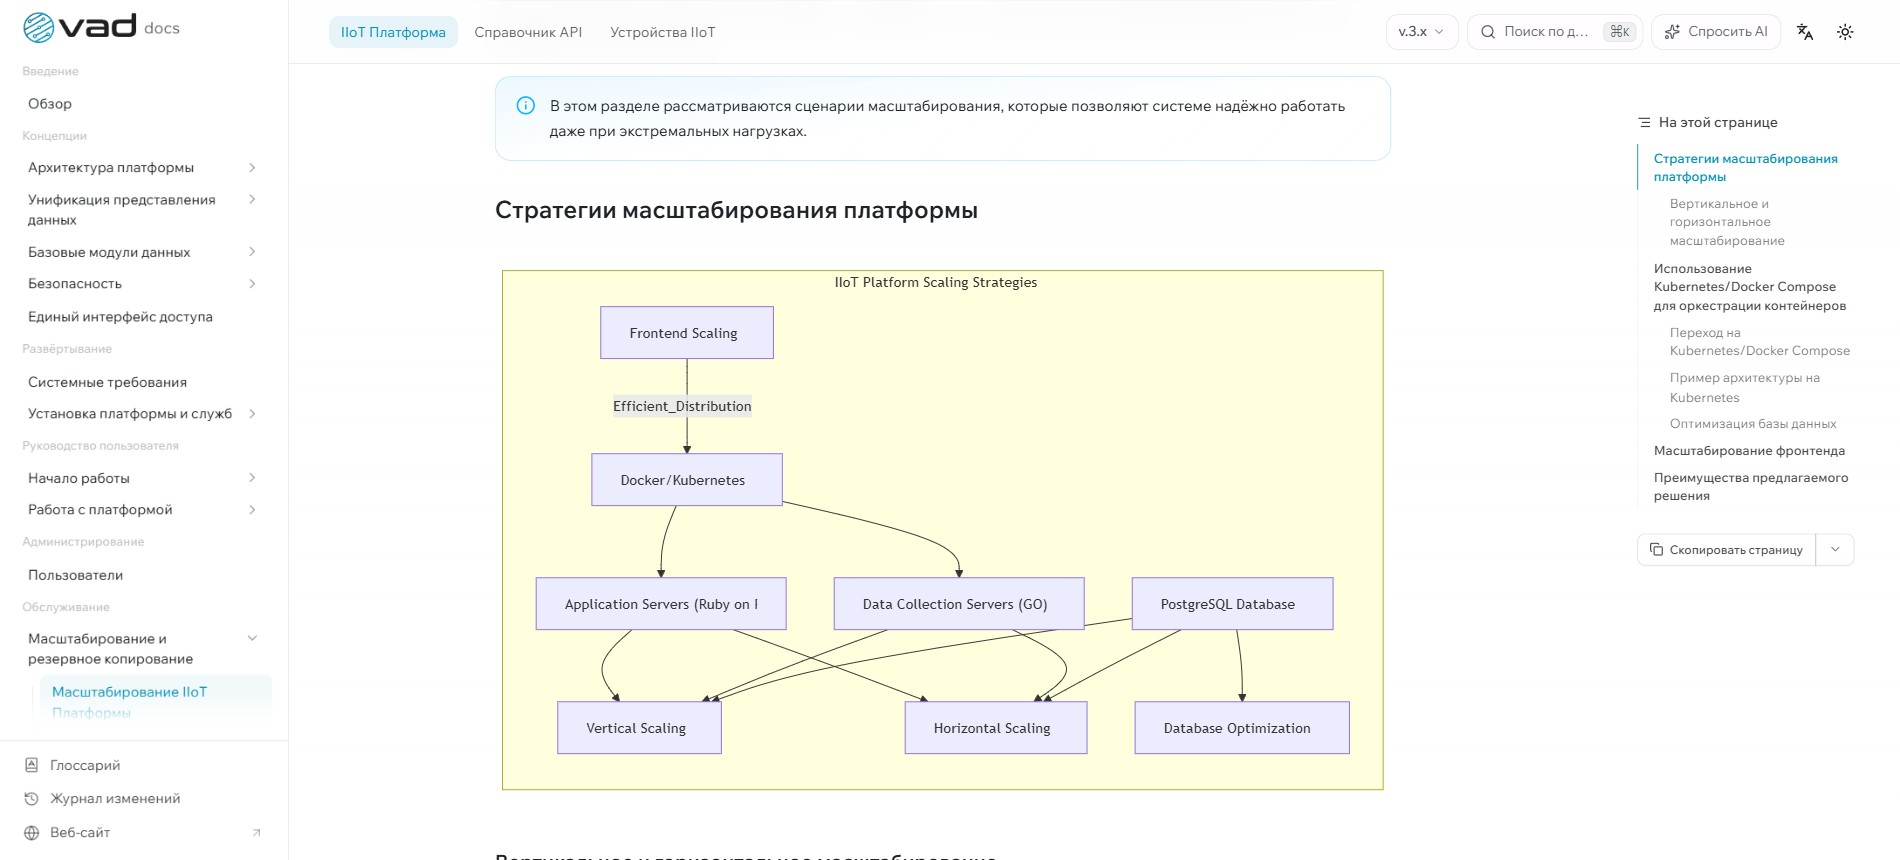
Interface: Fault-tolerant cluster
06

Fault-tolerant cluster

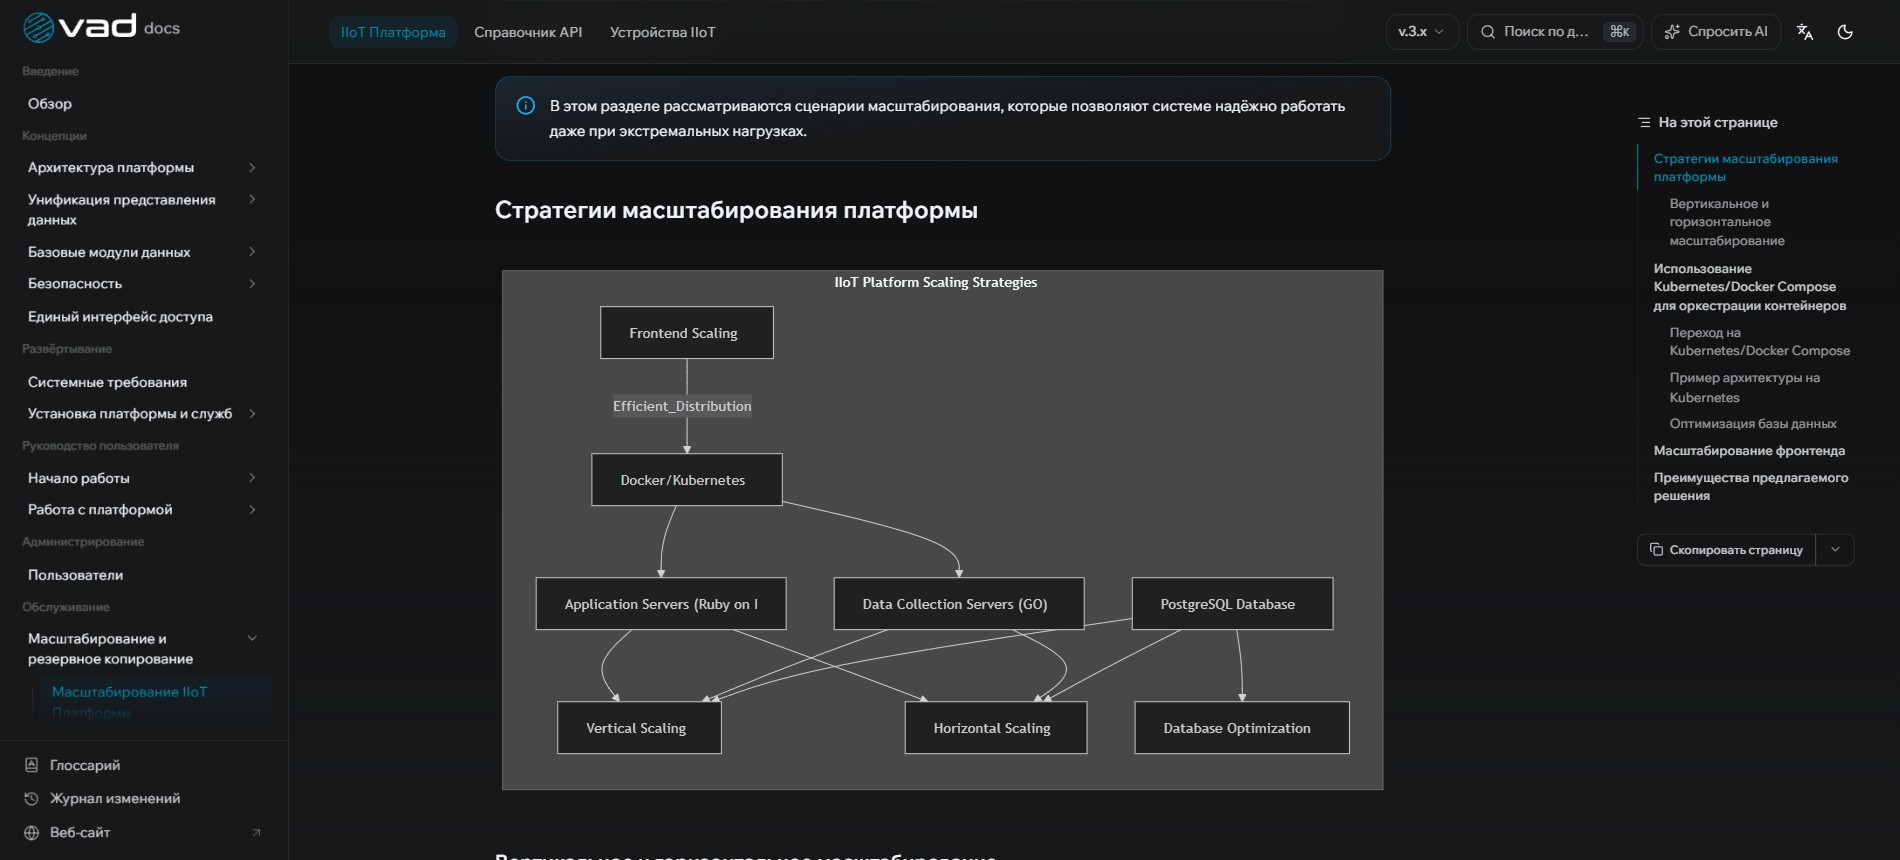
Horizontal scaling, service redundancy, and data replication keep device polling and equipment control running even when a node fails.

Scaling Redundancy Replication Backups
Open module /cluster
Interface: External integrations
07

External integrations

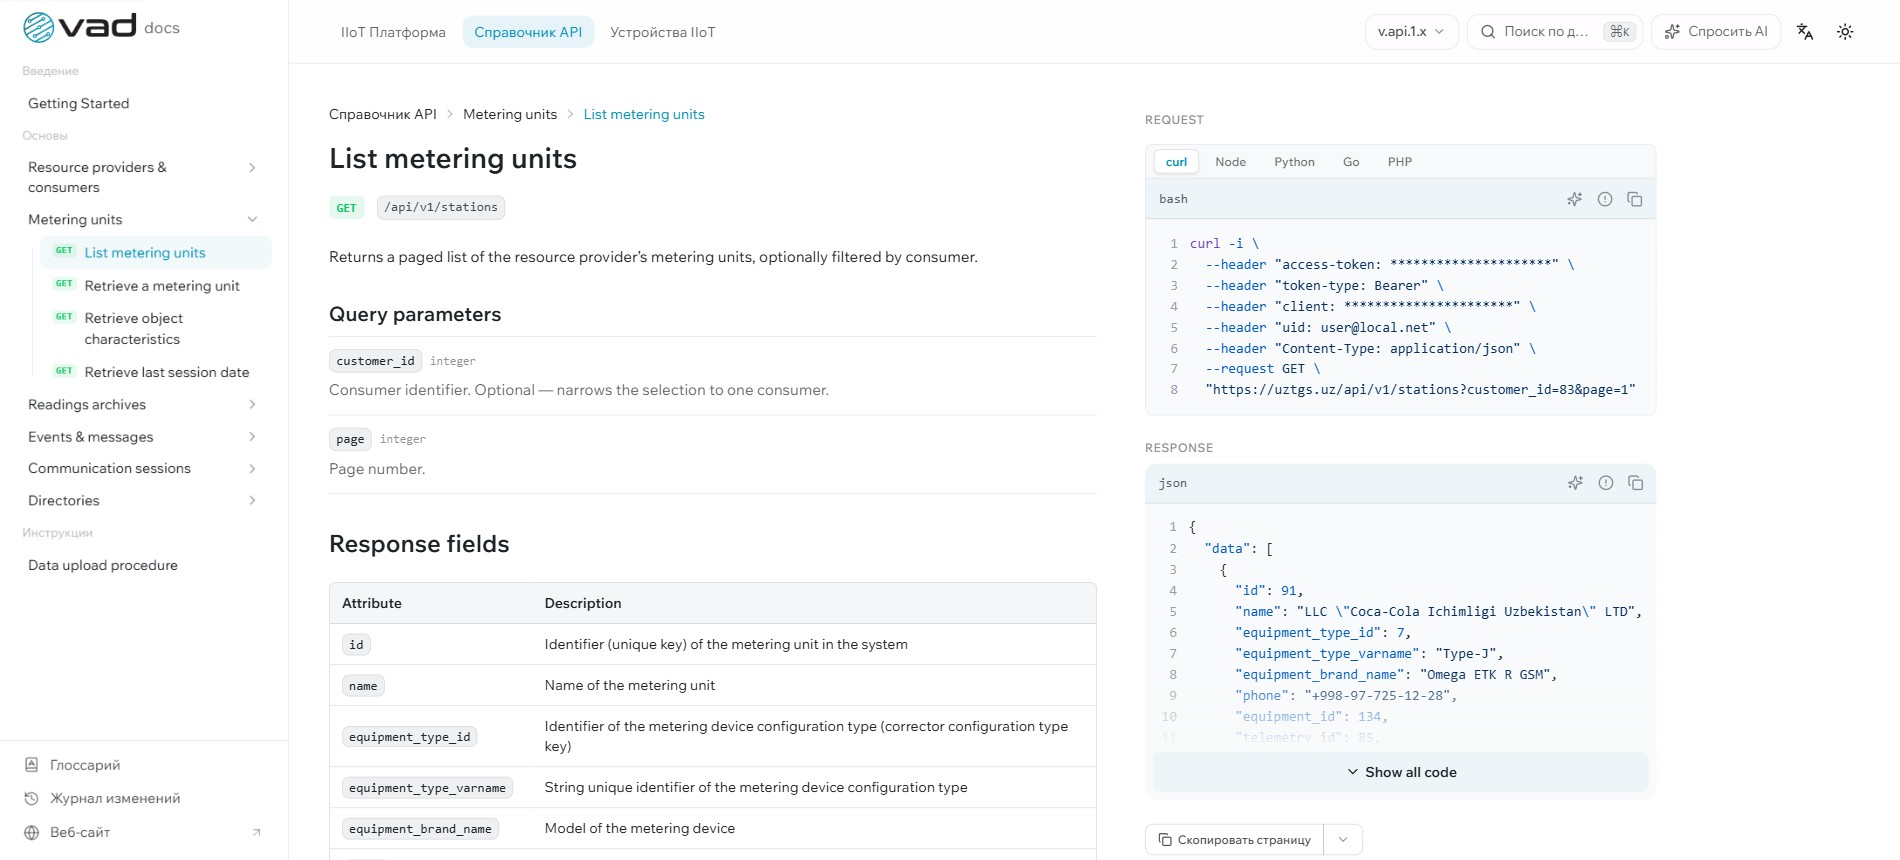
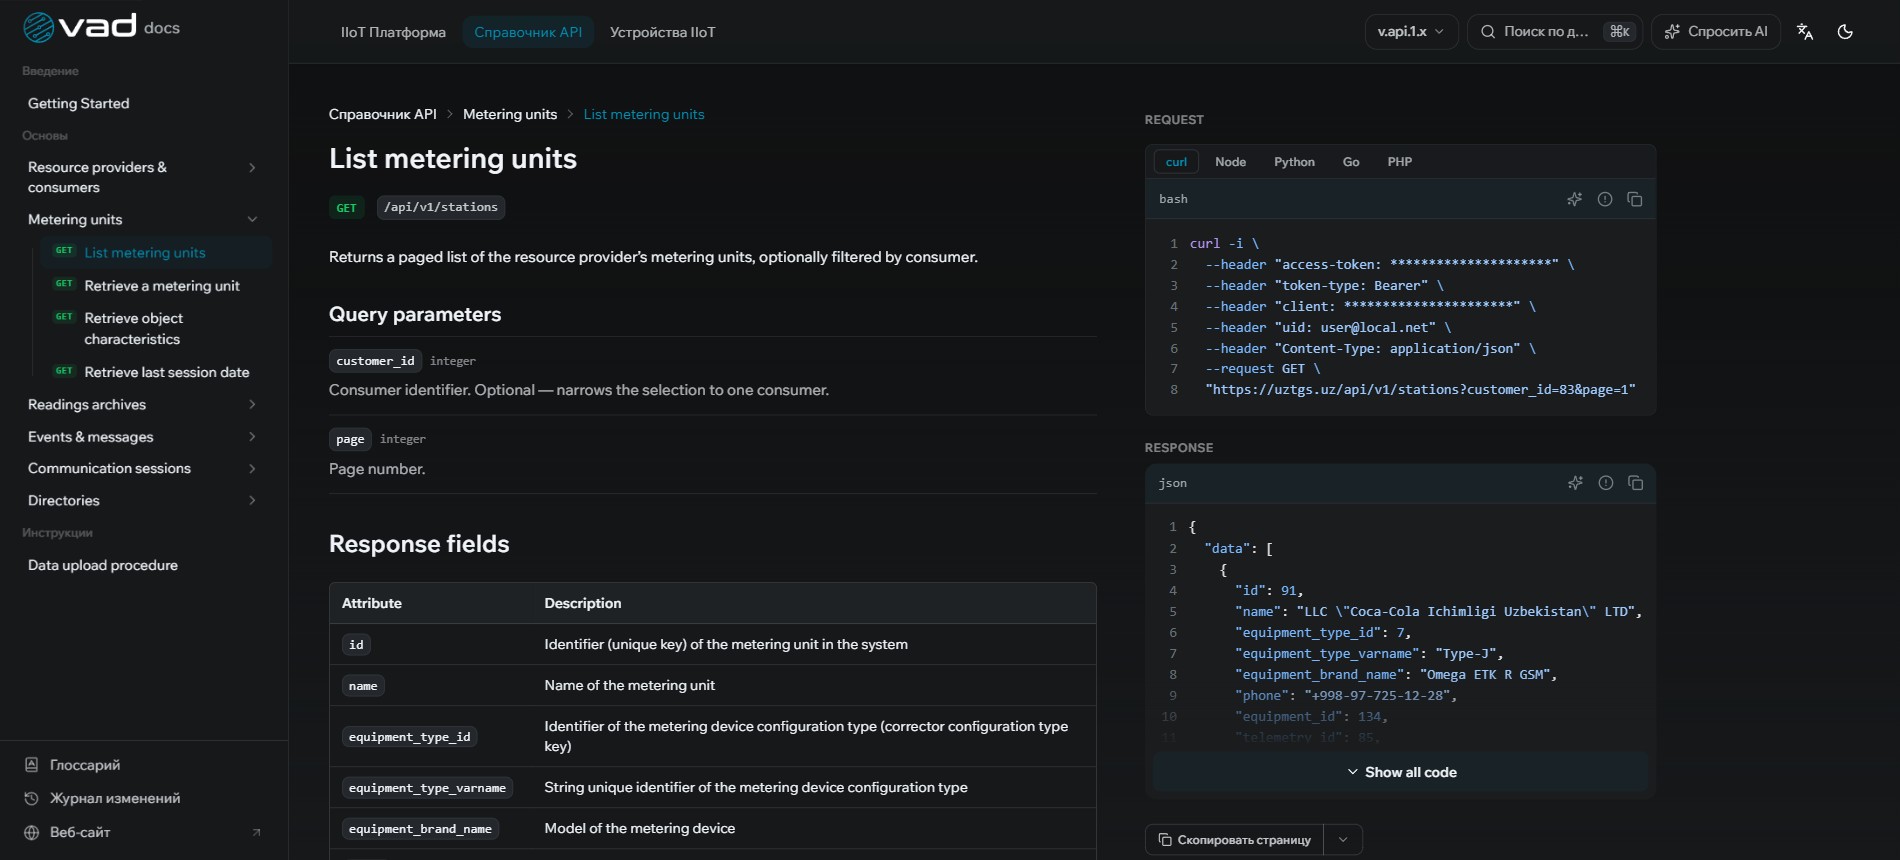
REST API and open data contracts make platform readings, states, and events available to the customer's accounting and dispatching systems.

REST API Communication protocols Drivers Data exchange
Interface: Documentation center
08

Documentation center

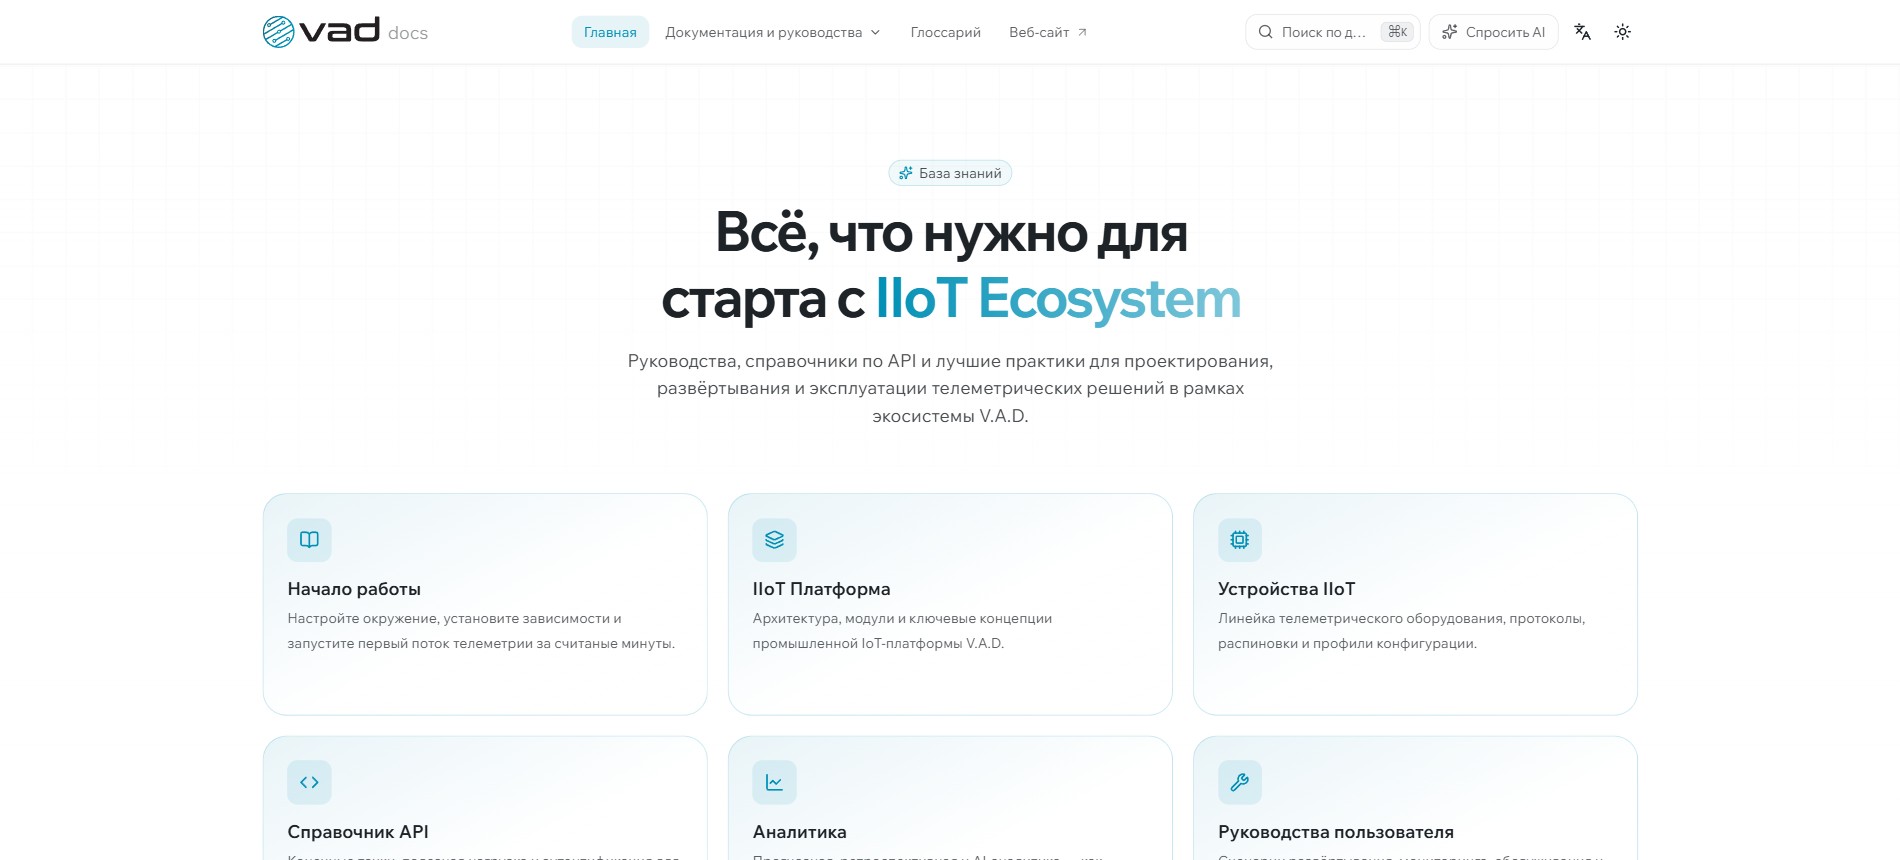
Architecture, installation, subsystem guides, and the API reference are all available in a unified ecosystem style and in multiple languages.

Architecture Installation Guides API Reference
Interface: Equipment
09

Equipment

A unified equipment fleet across the ecosystem: correctors, meters, pressure sensors, alarm units, and shutoff devices in one registry with types, connection schemes, and preinstalled drivers.

Metering Telemetry Shutoff Pressure sensors Types Drivers
Open module /equipment
Capabilities

Built for industrial operations

From device polling to verified resolution, every function supports a real dispatcher or metrologist workflow.

Telemetry collection

Automated scheduled polling plus manual and ad hoc communication sessions with devices

Unified equipment fleet

Correctors, meters, pressure sensors, and shutoff devices in one registry

Alarm events

Communication loss, abnormal modes, and pressure thresholds with instant notifications

Site map

Georeferenced metering points with statuses and quick access to each site

Archives and reports

Hourly and daily archives, reporting periods, and data export

Remote control

Commands to shutoff devices with execution confirmation

Roles and access

Permissions segmented by companies, branches, and divisions

Open integration

REST API and open contracts make the data available to your systems

Built on proven technologies

TypeScript
JavaScript
React
Node.js
Ruby on Rails
Go
Tailwind CSS
PostgreSQL
Docker
Nginx
Git

70+ device types

Correctors, meters, sensors, and alarm units from different manufacturers in one data model.

200+ equipment drivers

Preinstalled in the platform so a new device can be connected without additional development.

Connect. Monitor. Control.

The ecosystem can be deployed in your perimeter or in the cloud. Start with a pilot site and we will connect the first metering units within days.

Still have questions?

Did not find the answer? Contact us. We will help with a pilot project, device onboarding, and integration.

Contact us
Which devices are supported?

Gas volume correctors (EK-270, Flowgas, ULTRAMAG, and others), pressure sensors, alarm units, and shutoff devices. The supported equipment fleet is constantly expanding.

How do devices transmit data?

Telemetry is delivered over GSM and NB-IoT through scheduled, manual, and ad hoc sessions. Data is validated and appears in the archives within minutes after the session.

Does the platform integrate with our systems?

Yes: REST API, MQTT, and exports for SCADA and accounting systems. Open data formats without vendor lock-in.

What is Operations Center?

The Operational Health Matrix module turns telemetry signals into actionable operational tasks with owners, SLA, and data-based verification of the resolution. Read more in the documentation.

How is access control organized?

Roles and permissions are assigned by companies, branches, and divisions, so each user sees only their own sites and the actions available to them.

Where can I find the documentation?

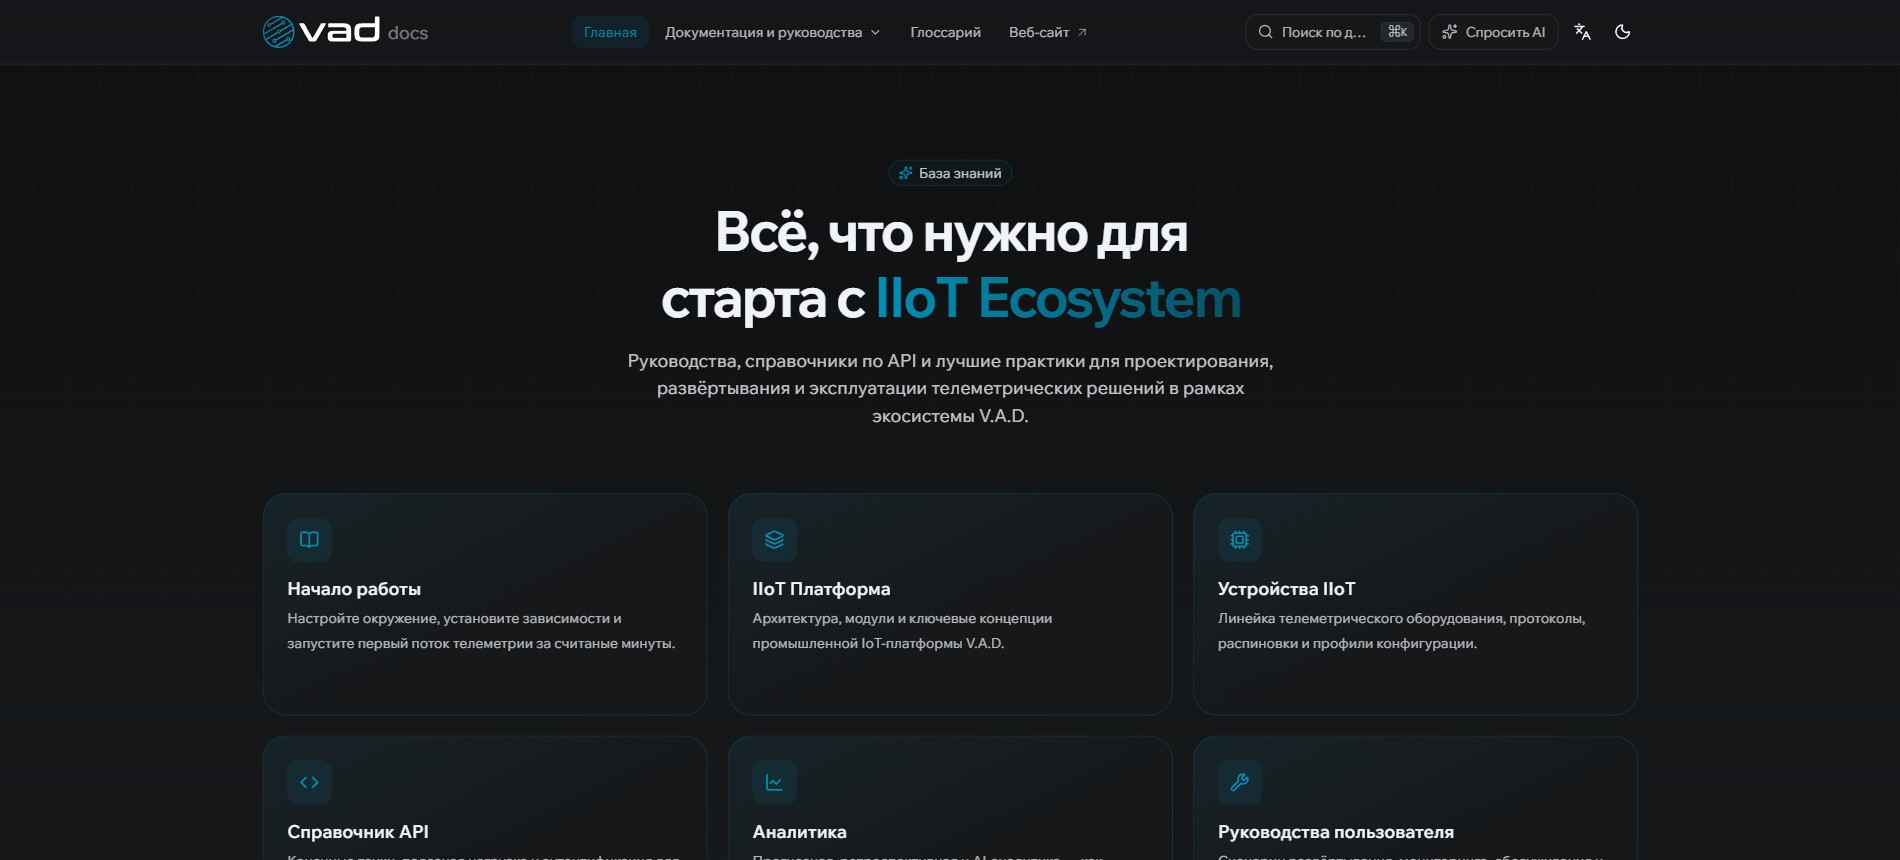
The complete guide, including setup, workflows, and API, is available at docs.vadsro.eu.

Nine connected industrial internet of things subsystems on a shared core: telemetry collection and analytics, SCADA dispatching, operational workflows, document handling, and a fault-tolerant cluster. One data model, one access layer. Developed by V.A.D. s.r.o.

© 2026 V.A.D. s.r.o. All rights reserved.

Version 3.0

IIOT ECOSYSTEM